Care & AI
Health & social care
Visualisation
Design
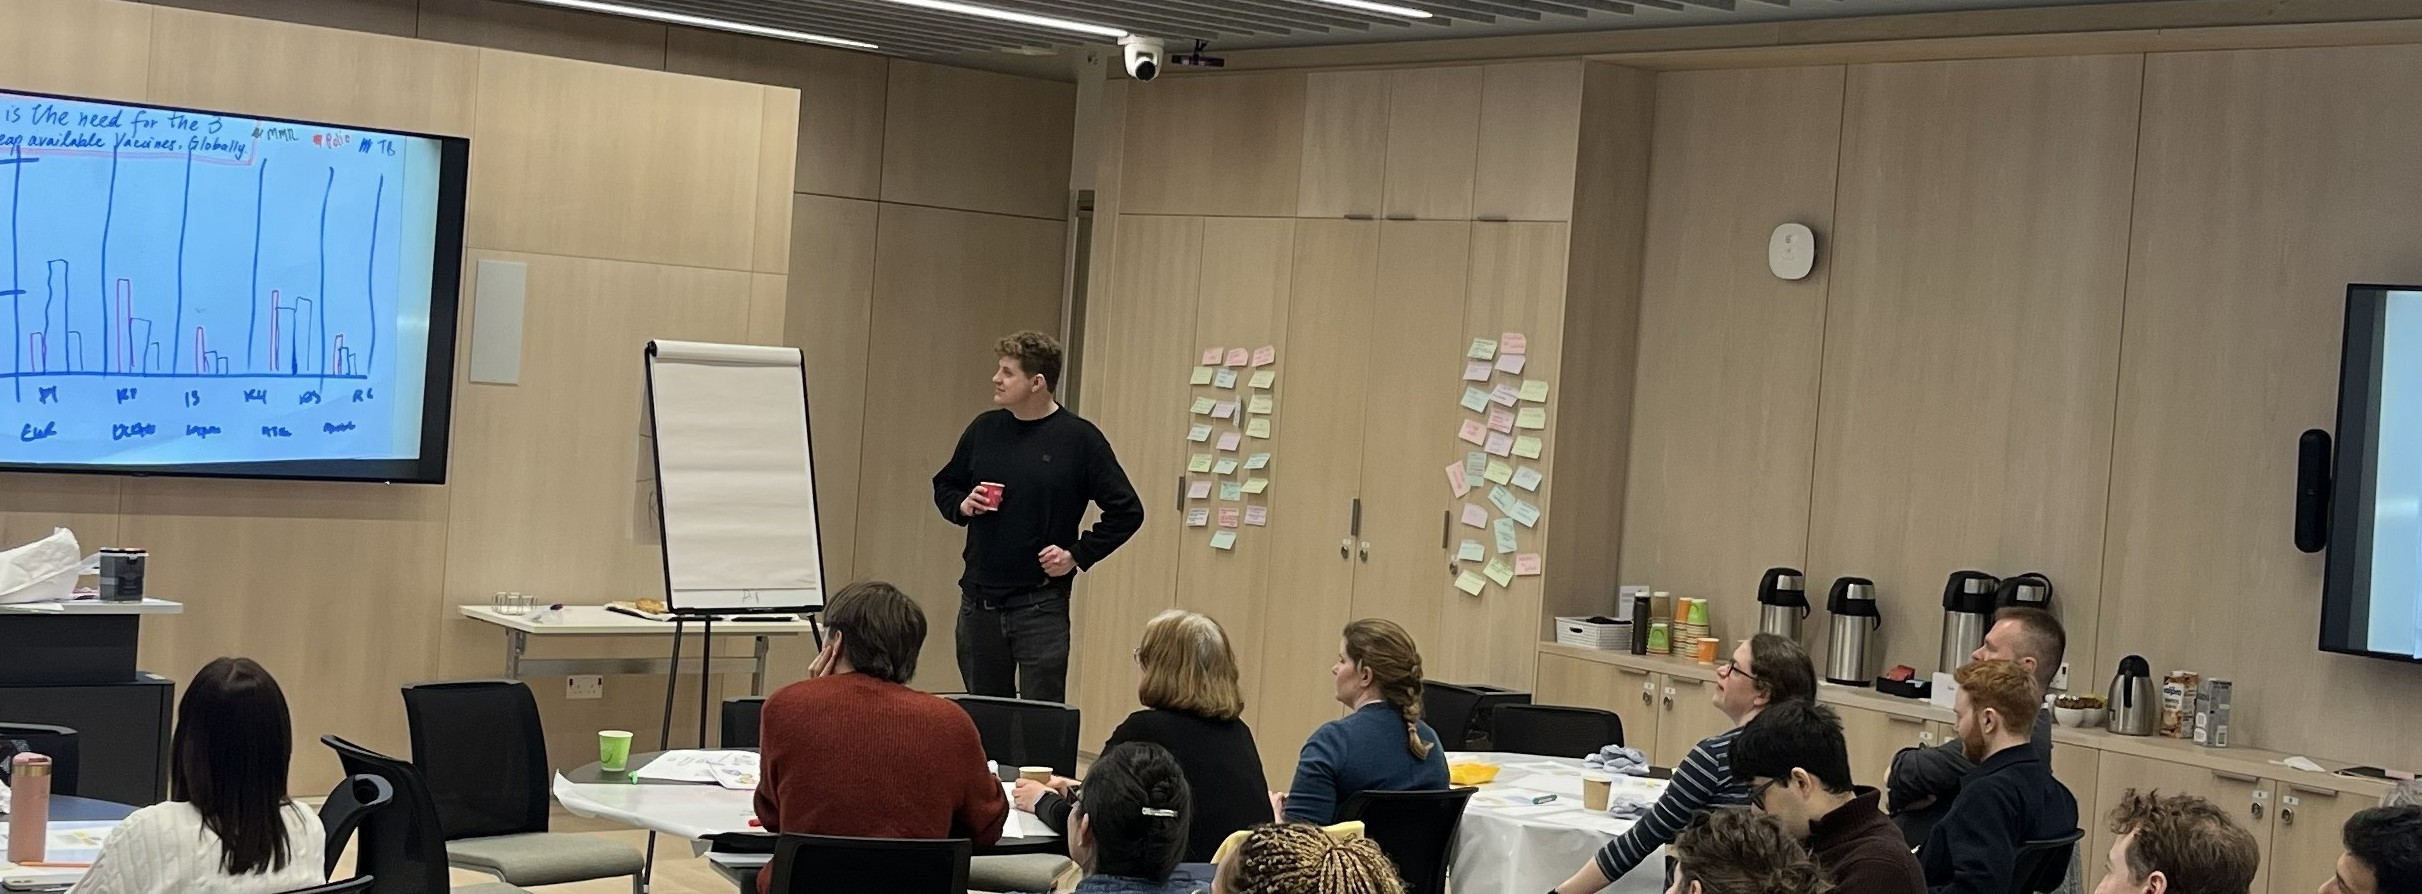
Workshops & Training
Visualisation thinking
Technology shaped by
care.
Working with organisations in health and social care to build AI and visualisation tools that fit how care actually works. Research-grounded, people-centred, designed with the sector, not imposed on it.

See the data.
Design the view.
Visualisation design grounded in encoding theory and active research, not templates. From dashboards to clinical decision support.
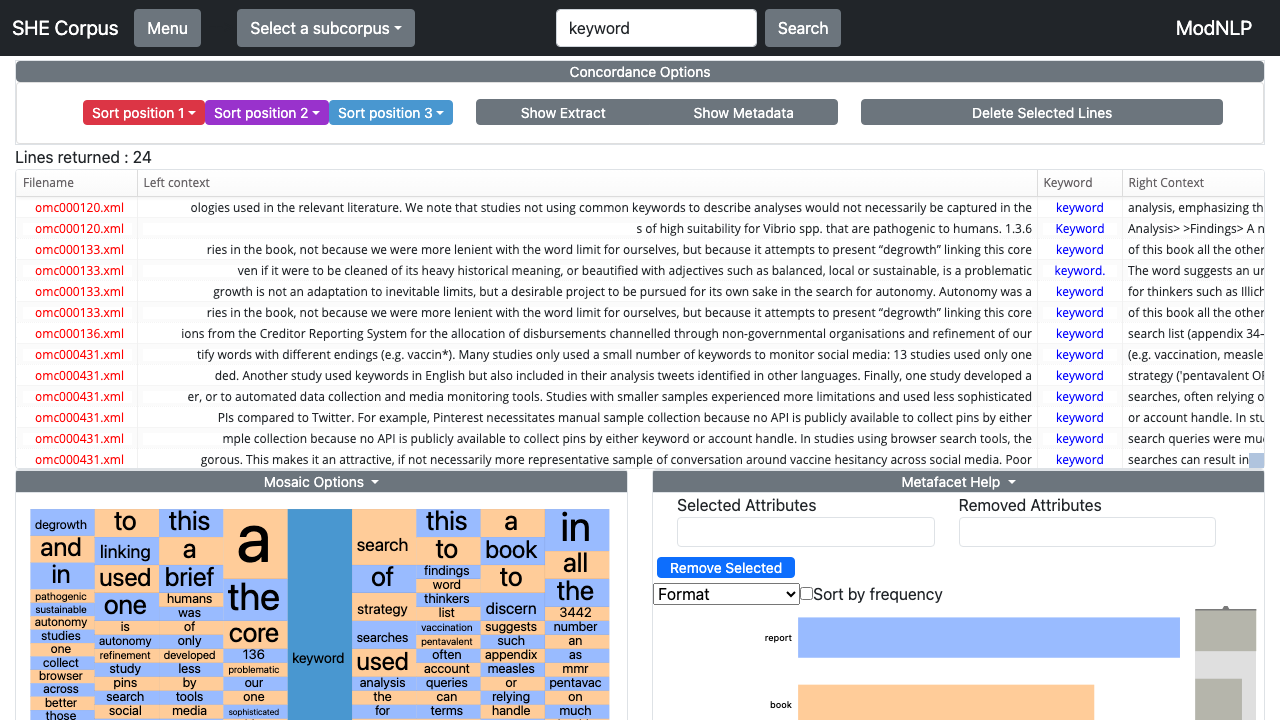
SHE Corpus visual interface. Interactive corpus linguistics tool built on visualisation research.
Visualisation thinking.
Mixed media. Real challenges.
Learn how data, visualisation, and technology transform work in the age of AI. I apply visualisation theory and mixed media methods to explore data challenges, rooted in active research. Booking subject to availability.